")

")

")

Modern businesses rely on data-driven decisions. Companies no longer depend on guesswork when measuring success. Instead, they use Performance Analytics to track metrics, evaluate results, and improve outcomes.
Organizations across industries use analytics platforms such as ServiceNow to measure operational efficiency. As a result, leaders gain clear insights into productivity, profitability, and long-term growth.
This comprehensive guide explains performance analytics meaning, tools, metrics, dashboards, careers, and real-world examples.
What Is Performance Analytics?
Performance Analytics is a process that collects, measures, and analyzes data to evaluate how well a system, organization, or process performs.
Businesses analyze performance data to identify trends, detect problems, and improve strategy.
Simple Definition
Performance analytics means using data and metrics to understand performance and make better decisions.
Key Objectives
Performance analytics focuses on several important goals:
- Measure business performance
- Identify strengths and weaknesses
- Track key performance indicators (KPIs)
- Improve operational efficiency
- Predict future outcomes
Therefore, companies can make smarter strategic decisions.
Why Performance Analytics Matters for Businesses
Today’s competitive market demands accurate performance insights. Without analytics, organizations struggle to understand what works and what fails.
Performance analytics provides several advantages.
Better Decision-Making
Data-driven insights help managers take confident actions.
Improved Productivity
Teams quickly identify inefficiencies and optimize workflows.
Higher Profitability
Companies detect revenue opportunities through performance metrics.
Strategic Planning
Analytics enables organizations to forecast future performance.
Consequently, businesses achieve sustainable growth.
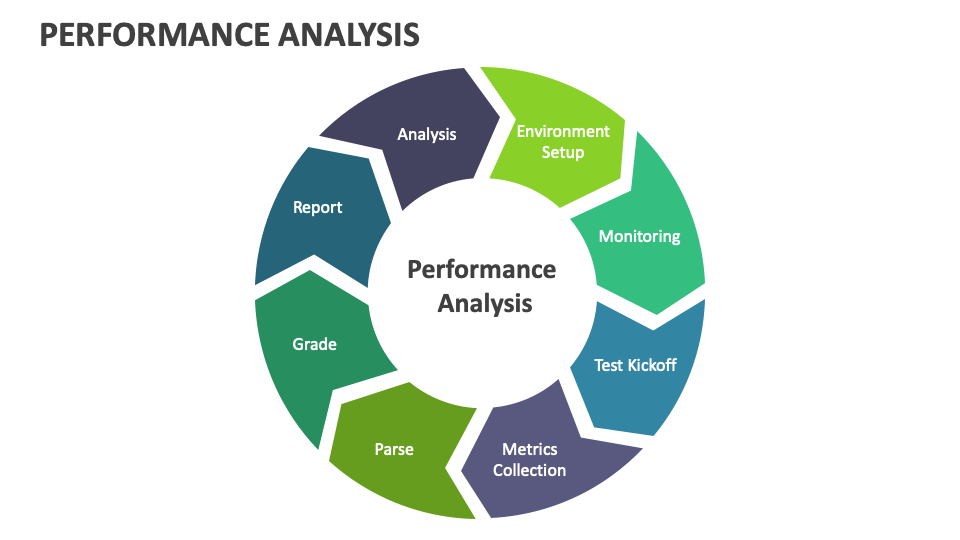
Performance Analytics vs Performance Analysis
Many people confuse performance analytics with performance analysis, but both concepts differ slightly.
| Aspect | Performance Analytics | Performance Analysis |
|---|---|---|
| Focus | Continuous monitoring | Detailed evaluation |
| Data usage | Automated dashboards | Manual investigation |
| Purpose | Track trends | Identify specific problems |
| Tools | Analytics platforms | Analytical methods |
Therefore, analytics provides real-time monitoring, while analysis focuses on deep investigation.
Performance Analytics Dashboard
A Performance Analytics Dashboard visually displays performance metrics in one place.
Organizations use dashboards to monitor progress and trends instantly.
Common Dashboard Components
- KPI indicators
- Trend graphs
- Performance scorecards
- Data tables
- Forecast charts
Platforms like ServiceNow provide advanced analytics dashboards.
Benefits of Analytics Dashboards
Dashboards deliver several benefits:
- Real-time performance tracking
- Faster decision-making
- Clear visual insights
- Improved team accountability
As a result, businesses manage operations efficiently.
Performance Analytics Software
Modern organizations use specialized tools to automate analytics.
Popular Performance Analytics Software
Several tools dominate the analytics market.
- ServiceNow – enterprise performance analytics
- Tableau – advanced data visualization
- Microsoft Power BI – business intelligence analytics
- Google Analytics – website performance analysis
- SAP Analytics Cloud – enterprise planning and analytics
These tools help companies monitor KPIs, build dashboards, and generate insights.
Performance Analytics in ServiceNow
ServiceNow offers one of the most powerful performance analytics solutions for enterprises.
The platform collects operational data and transforms it into actionable insights.
Key Features
- Automated KPI tracking
- Predictive analytics
- Interactive dashboards
- Trend analysis
- Data forecasting
Organizations use ServiceNow Performance Analytics to improve IT operations, service management, and workflow efficiency.
What Are the 5 Key Performance Metrics?
Businesses rely on several core metrics to measure success.
1. Revenue Growth
Revenue growth measures how quickly a company increases its income over time.
2. Customer Acquisition Cost (CAC)
CAC calculates how much it costs to acquire a new customer.
3. Customer Retention Rate
Retention rate tracks how many customers continue using a service.
4. Conversion Rate
Conversion rate measures the percentage of visitors who complete an action.
5. Operational Efficiency
Operational efficiency evaluates how effectively a company uses resources.
Together, these metrics provide a complete performance overview.
What Are the 4 Methods of Analyzing Performance?
Organizations use several analytical approaches to evaluate performance.
1. Descriptive Analysis
Descriptive analysis explains what happened in the past.
Example: monthly sales reports.
2. Diagnostic Analysis
Diagnostic analysis identifies why something happened.
Example: investigating a drop in website traffic.
3. Predictive Analysis
Predictive analysis forecasts future outcomes using historical data.
4. Prescriptive Analysis
Prescriptive analysis recommends actions for improvement.
These methods create a structured framework for performance evaluation.
What Are the 4 Types of Data Analysis?
Performance analytics relies on four major data analysis types.
Descriptive Data Analysis
Summarizes historical data and trends.
Diagnostic Data Analysis
Explains causes behind performance changes.Predictive Data Analysis
Uses statistical models to forecast future trends.
Prescriptive Data Analysis
Suggests strategic actions based on predictions.
Therefore, businesses gain both insight and direction.
Virtual Close Accounting and Performance Analytics
Financial teams increasingly use analytics in virtual close accounting.
Virtual close accounting allows companies to complete financial closing processes faster using automation and analytics.
Performance analytics improves this process by:
- monitoring financial performance
- detecting accounting errors
- forecasting financial trends
- improving reporting accuracy
Consequently, organizations achieve faster financial transparency.
Performance Analytics Course
Learning performance analytics opens strong career opportunities.
Popular courses teach:
- Data analysis fundamentals
- Business intelligence tools
- Dashboard creation
- KPI tracking
- Predictive analytics
Many professionals learn analytics through training programs related to ServiceNow, Tableau, and Microsoft Power BI.
These courses prepare individuals for analytics careers.
Performance Analytics Jobs
Demand for analytics professionals continues to grow worldwide.
Common job roles include:
- Performance Analyst
- Data Analyst
- Business Intelligence Analyst
- Financial Analyst
- Operations Analyst
Companies rely on analytics experts to convert data into actionable insights.
Performance Analyst Salary
The Performance Analyst role offers competitive salaries.
Average global salary ranges:
| Experience | Salary |
|---|---|
| Entry Level | $60,000 |
| Mid Level | $85,000 |
| Senior Analyst | $120,000+ |
Salaries increase with expertise in tools like ServiceNow and Tableau.
Performance Analytics in the Financial Industry
Financial companies use analytics extensively.
For example, Mastercard analyzes transaction data to detect trends, manage risk, and optimize payment systems.
Financial analytics helps companies:
- detect fraud
- improve risk management
- understand customer behavior
- increase revenue opportunities
Therefore, analytics becomes essential in modern finance.
How to Implement Performance Analytics
Organizations should follow a structured approach.
Step 1: Define KPIs
Identify the key performance indicators relevant to business goals.
Step 2: Collect Data
Gather accurate data from multiple sources.
Step 3: Analyze Data
Use analytics tools to identify patterns.
Step 4: Build Dashboards
Visualize insights using performance dashboards.
Step 5: Improve Strategy
Use insights to optimize processes and performance.
This process ensures continuous improvement.
Future of Performance Analytics
The future of analytics looks promising due to emerging technologies.
Important trends include:
- Artificial Intelligence analytics
- Real-time data monitoring
- Predictive decision systems
- Automated performance insights
As technology evolves, analytics will become even more powerful.
Conclusion
Performance analytics plays a crucial role in modern organizations. Businesses rely on data insights to track performance, identify opportunities, and improve decision-making.
Tools such as ServiceNow, Tableau, and Microsoft Power BI enable companies to monitor KPIs and visualize performance data.
Ultimately, organizations that adopt performance analytics gain a significant competitive advantage.
Data-driven insights lead to smarter strategies, higher efficiency, and sustainable growth.